
The Dashboard
The dashboard is stepbook's visual inspector — a local React app that reads the same state/ directory the CLI writes. It's where you browse runs, inspect each step's output, compare runs, and run stability and query analyses interactively.
It's optional: everything the dashboard shows is also available from the CLI. But for exploring a pipeline and chasing down "what changed and why," the UI is usually faster.
Launching it
stepbook dashboard            # opens http://127.0.0.1:6125
stepbook dashboard -p 7000    # a specific port (strict — errors if taken)
Or, from the stepbook repo itself, npm run dev runs the dashboard against examples/demo and falls through to the next free port if 6125 is busy. The difference: npm run dev is lenient about the port, stepbook dashboard -p <n> is strict — because there you asked for a specific one.
Layout
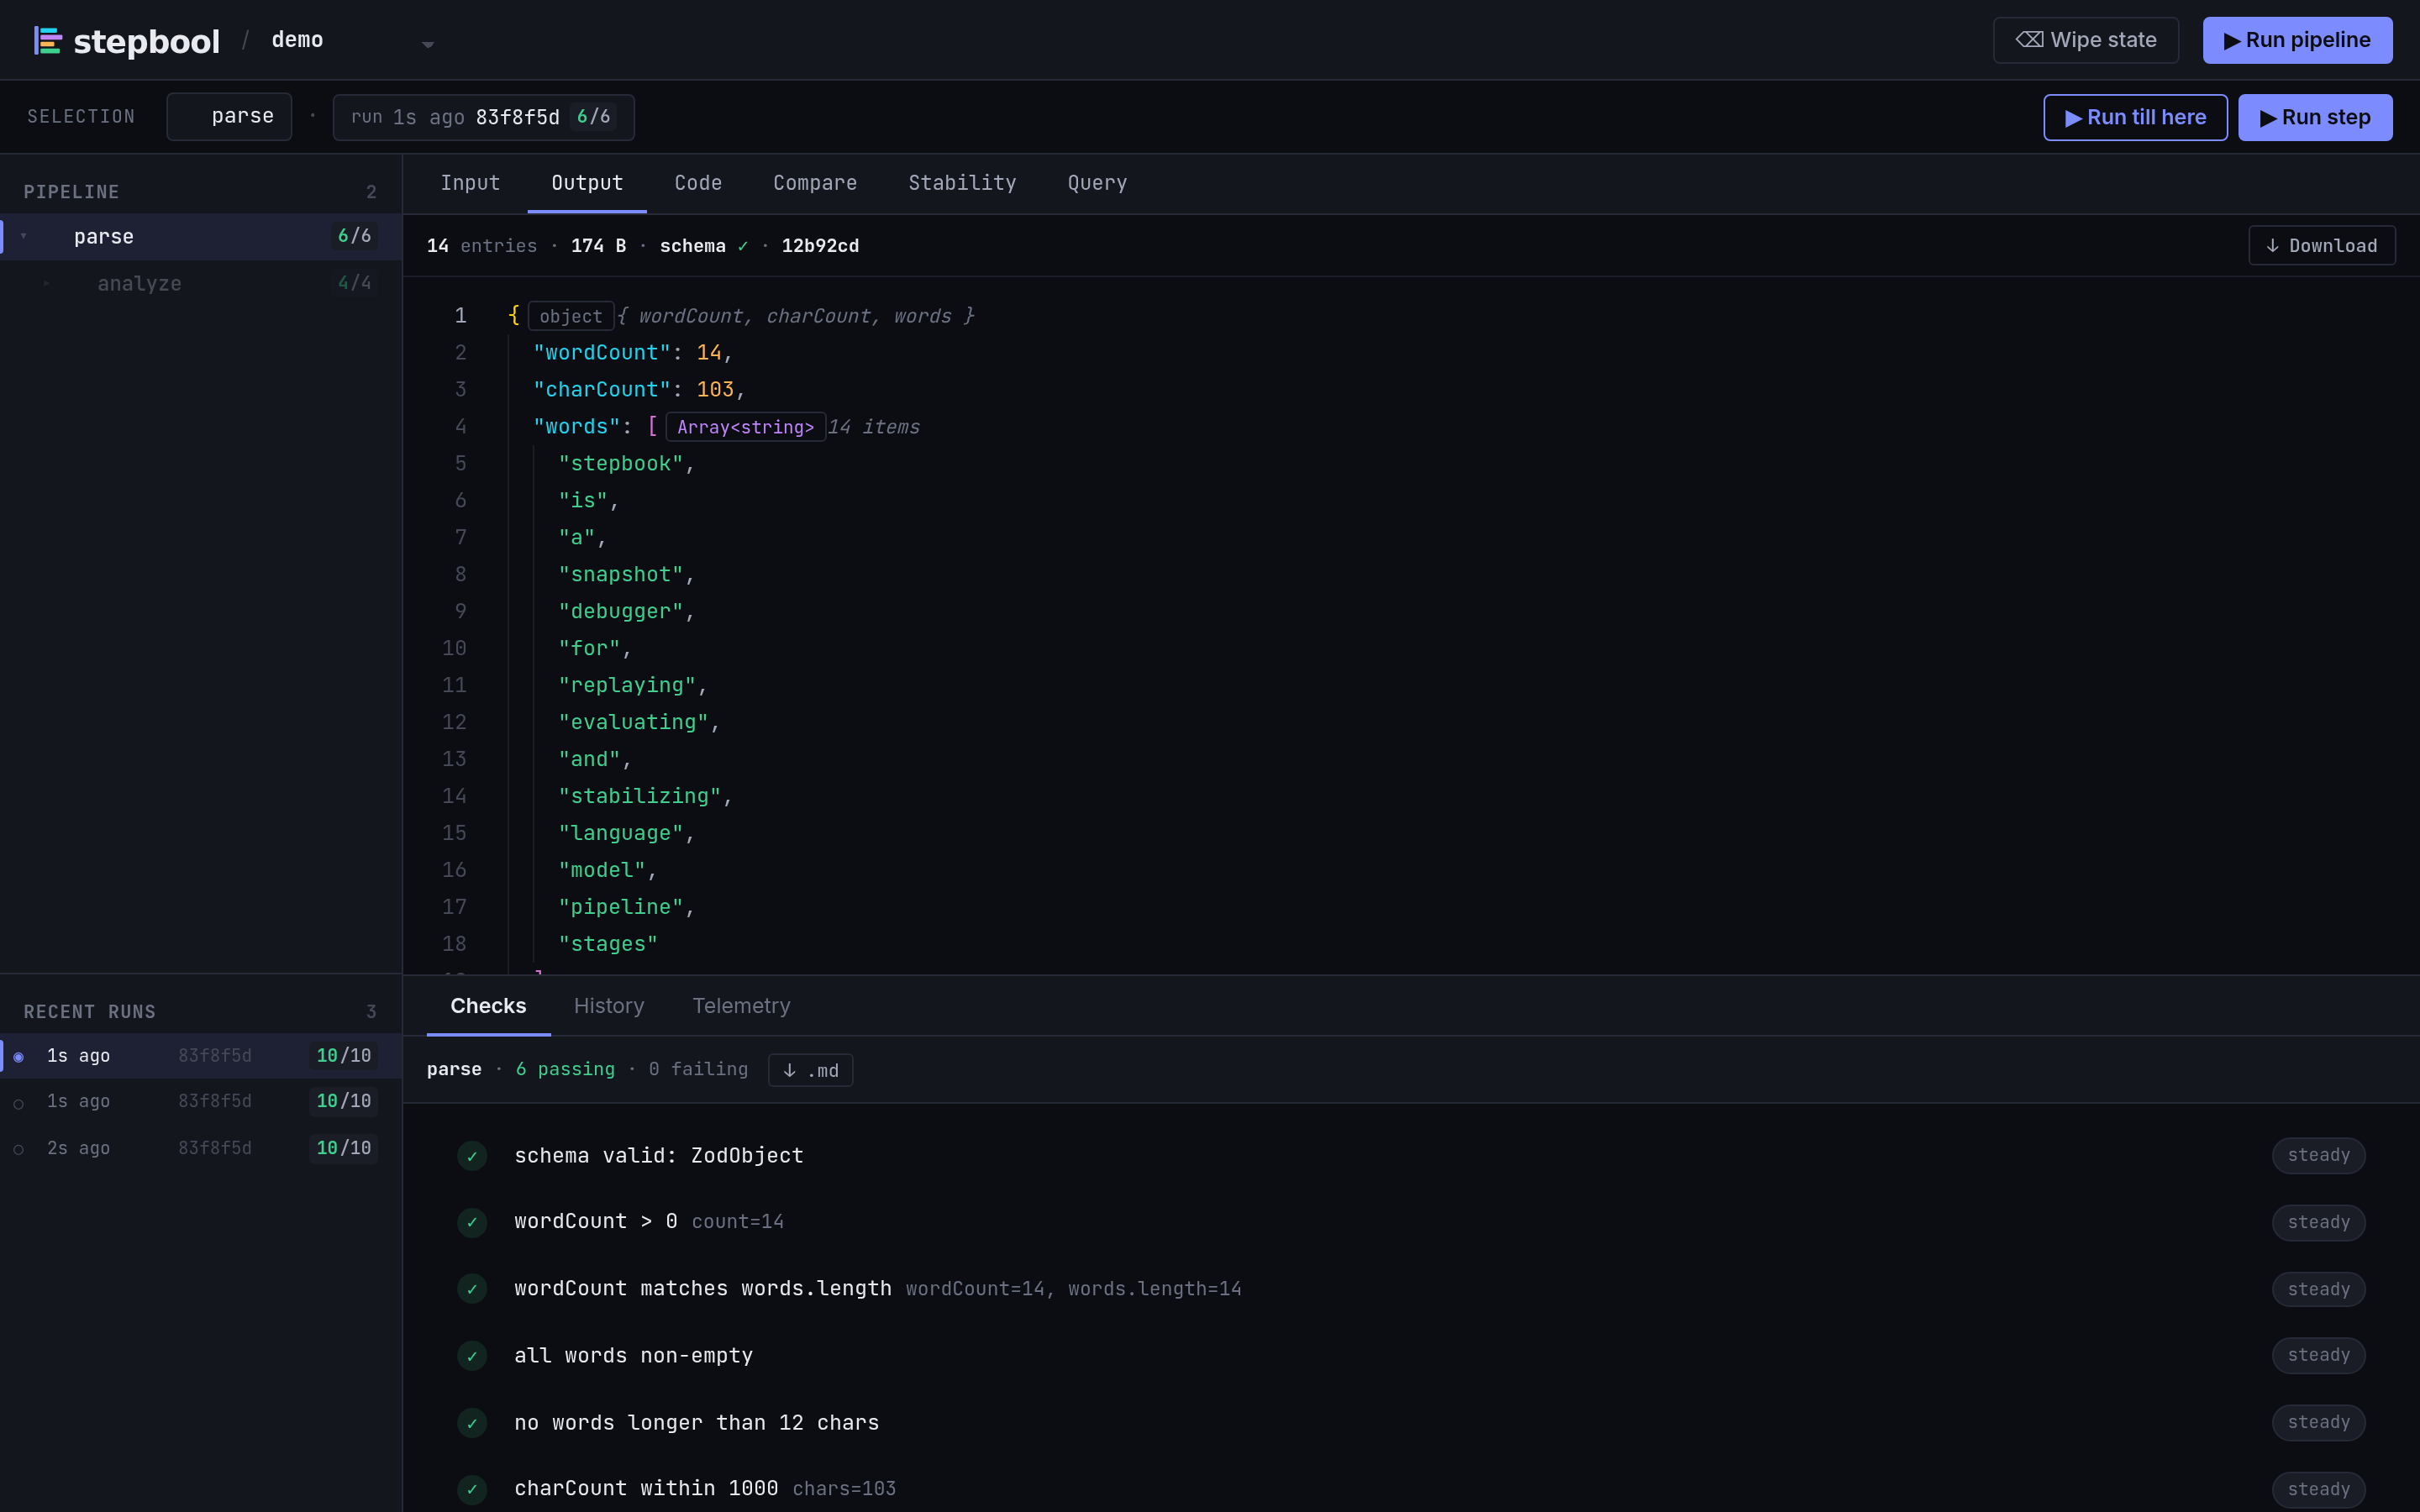
The dashboard has three regions:
- Left rail — the selected run's trajectory as a tree of nested, selectable nodes, plus a list of recent runs. A straight-line pipeline lists its units; an agent expands into its turns (
decide#0,act#0,decide#1, …), and nested calls nest. Selecting a node focuses the canvas on that call; selecting a run points every panel at that run's snapshot. - Canvas (the main area) — per-node views of the currently selected node: its input, its output, its source code, and the analysis views.
- Bottom drawer — addon panels that span the whole run rather than a single node: checks, history, and telemetry.
A project switcher in the top nav lets you point the dashboard at a different stepbook project under your workspace without restarting it.
Canvas views (per node)
These follow the trajectory node you've selected in the left rail.
Input — the exact data that call received: the argument the runner passed when it invoked this unit (for a loop turn, the state at that turn). For the entrypoint node it's the pipeline input. You can pick which input file or run to view.
Output — this node's output for the selected run, rendered structurally.
Code — the unit's source file, opened read-only. A source-link button opens it in your editor (configurable via
editorin the config).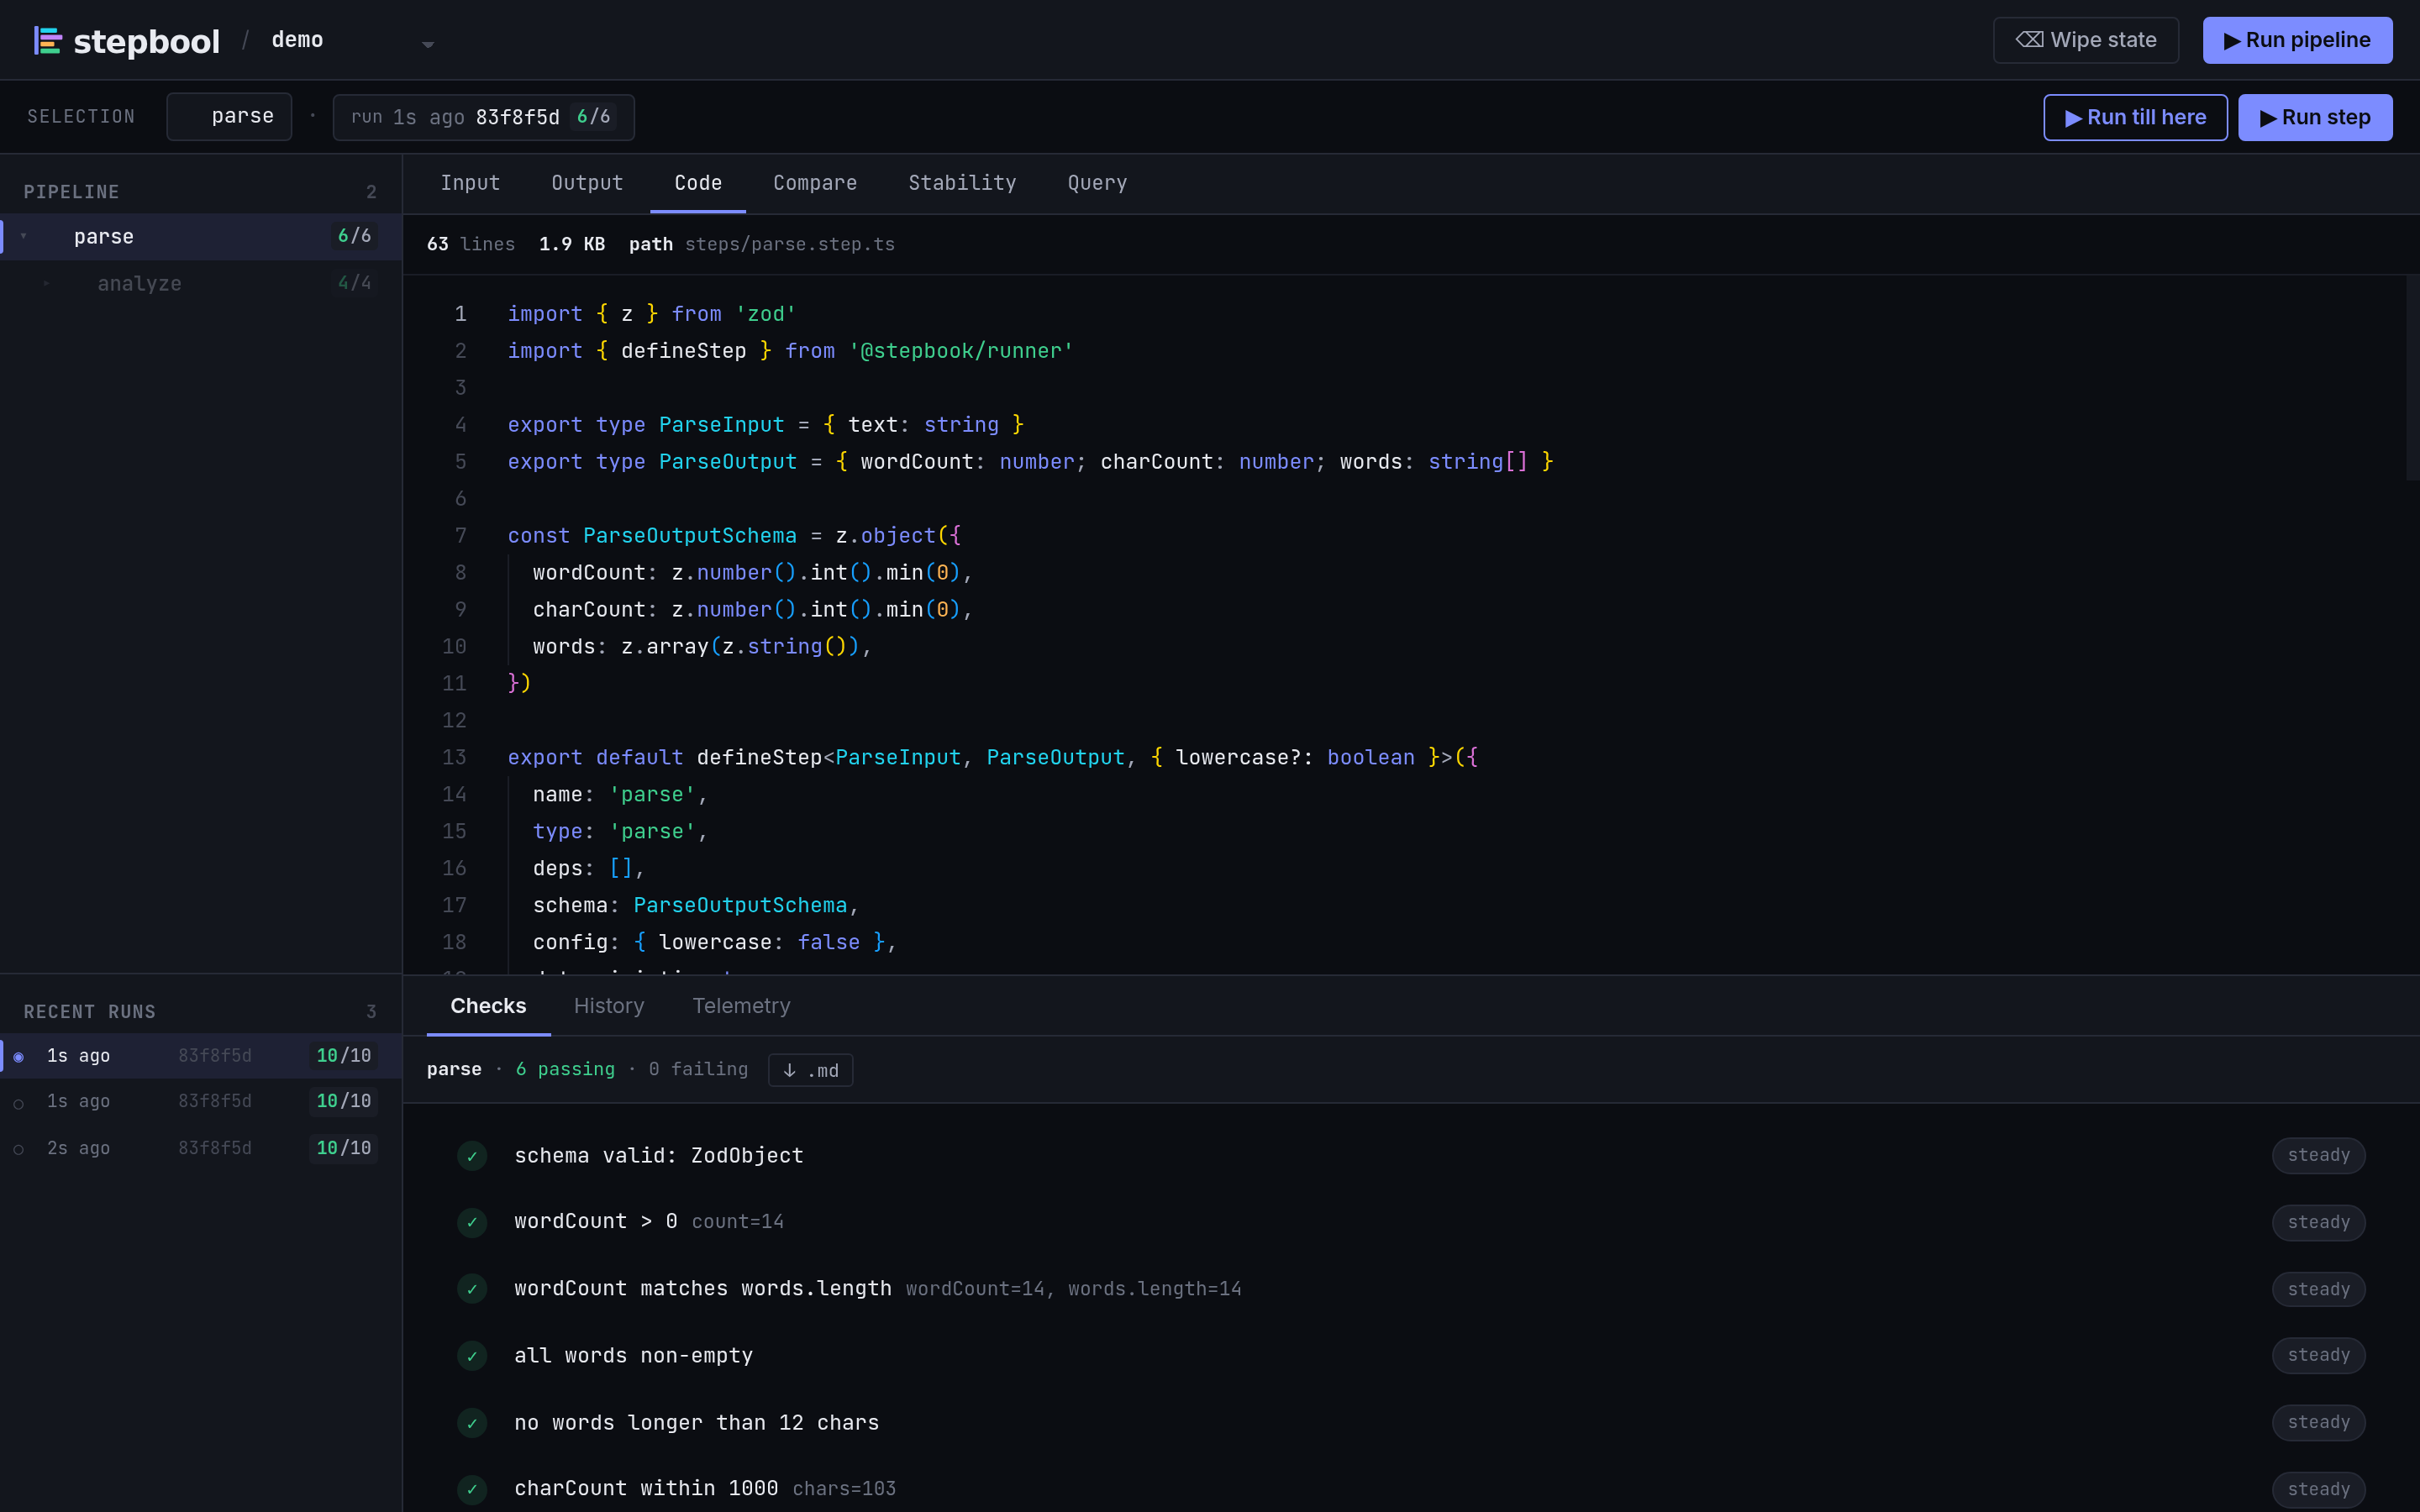
Compare — diff this node's output between two runs, side by side. The visual counterpart to
stepbook snapshot-diff.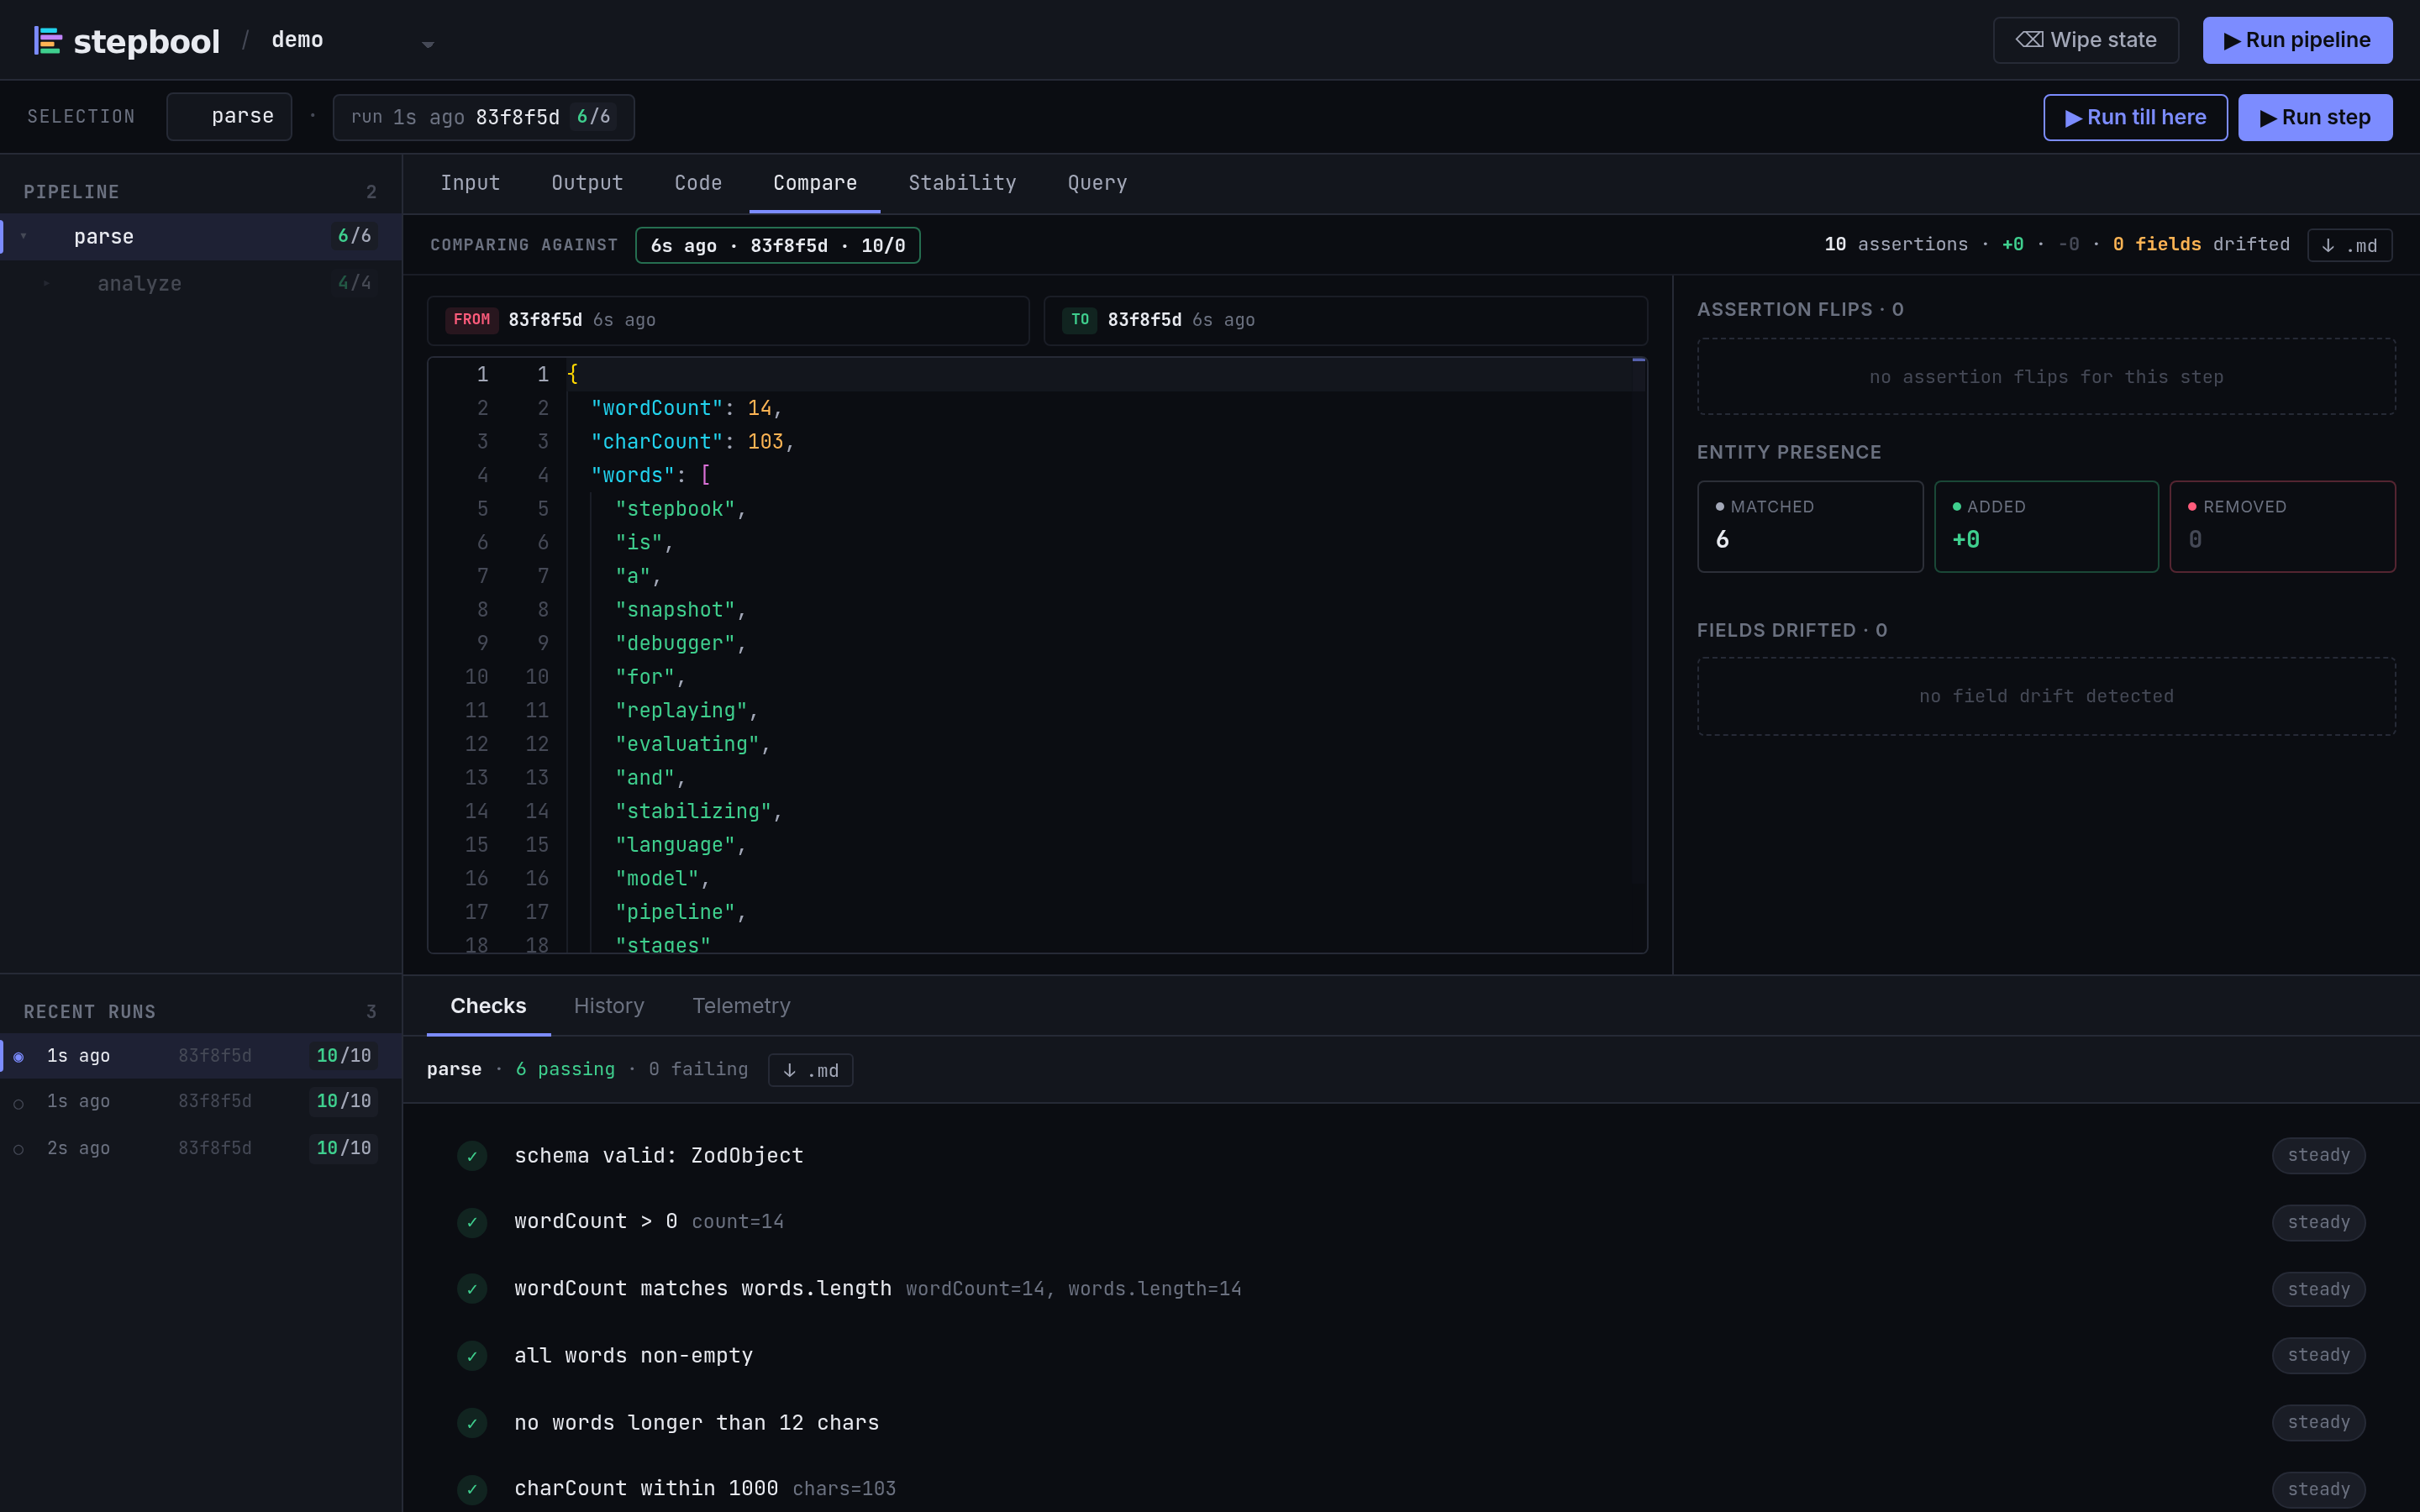
Stability — run this unit N times (or use the last N historical runs) and see the outputs clustered by similarity, with outliers flagged. The visual counterpart to
stepbook variance. Most useful for LLM units. See Drift & Stability.Query — run a query against this node's output and view the result as a table, JSON, or raw value. The Monaco editor is in YAML mode with query-keyword completion — the same StepQL the
stepbook qcommand runs; drop into raw JSONata via thejsonata:field. Saved queries persist per step with their language tag so recall round-trips correctly.
Addon panels (whole run)
These live in the bottom drawer and reflect the selected run as a whole.
Checks — every assertion result for the run, grouped by node, with failing items expanded inline. The tab carries a live badge when checks are failing.
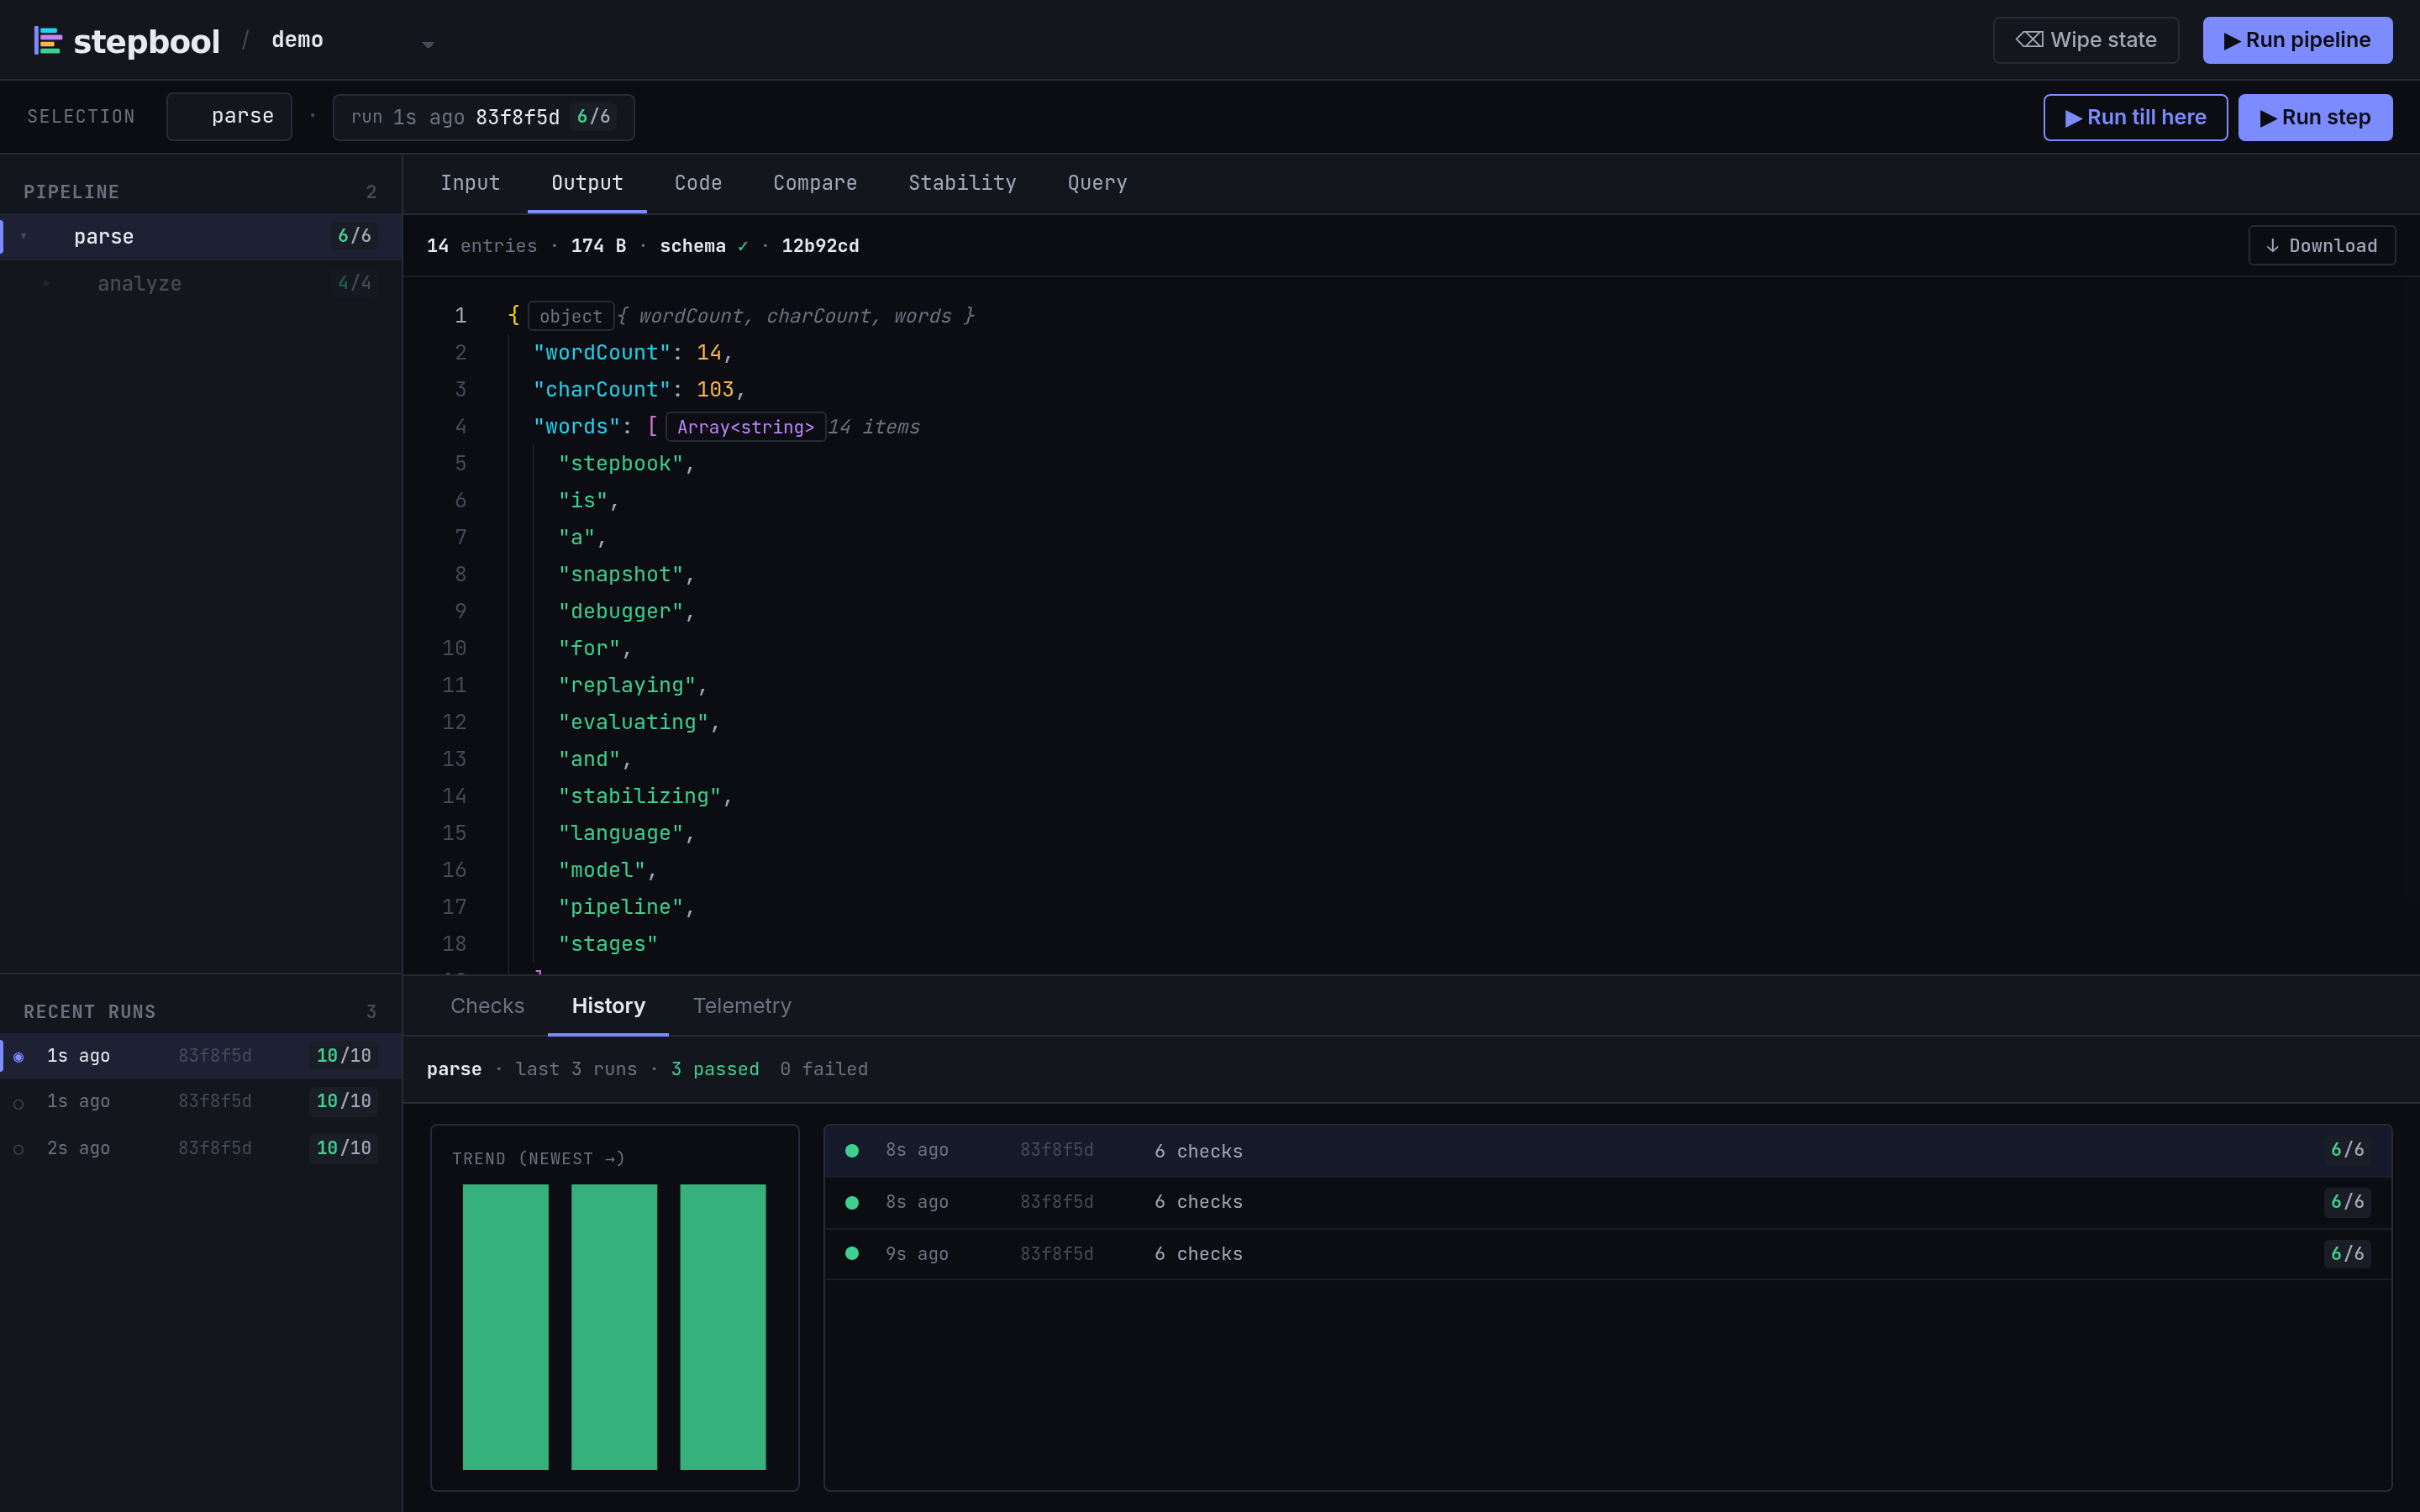
History — every run, newest first; sortable and filterable. Selecting a run here drives the rest of the UI.
Telemetry — cost, latency, token counts, and cache-hit rates over time, drawn from what your units report via
ctx.report— summed across a loop's turns. Seectx.report.
Running from the UI
You don't have to drop to the terminal to execute the pipeline. The dashboard can trigger runs the same way the CLI does, including the partial-run shortcuts:
- Run — execute the whole pipeline against the canonical input.
- Run from here — re-execute from the selected unit onward (maps to
--from <unit>). - Run unit — re-execute just the selected unit with cached neighbors (maps to
--just <unit>).
Because each unit call is cached on its source-file hash, editing a unit file and re-running from the UI re-executes only what actually changed. See The Cache.
Live reload
When you edit a unit file or the pipeline while the dashboard is open, it picks up the change without a full page reload — the trajectory tree and source views stay in sync. Re-run from the UI to see the new output.
Next
- Extending the Dashboard — add your own panels.
- Drift & Stability — the analysis behind the Compare and Stability views.